
Category: Resource Management | Read time: 9 min | Published: 3 July 2026
Utilisation is the heartbeat metric for any professional services firm. If you do not know what percentage of your team's time is genuinely billable — versus internal meetings, administration, business development, and hours lost to poor planning — you are running blind. Billable utilisation tracking software makes that number visible in real time, across every person and every project, so you can act on it rather than discover it weeks too late.
What Is Billable Utilisation and Why Does It Matter?
Billable utilisation is the proportion of your team's total working hours that are charged to clients. A consultant working 40 hours per week with 30 billable hours has a utilisation rate of 75%. Most professional services firms in the UK target between 65% and 80%, depending on their model, the seniority mix of their team, and how much non-billable investment they make in business development and capability building.
There are two related but distinct figures worth tracking:
- Billable utilisation — the percentage of total available hours billed to clients.
- Productive utilisation — the percentage of total available hours spent on meaningful work of any kind, including business development and skills development. Always higher than billable utilisation.
The gap between productive and billable utilisation tells you how much meaningful non-billable work your team is doing — and whether it is a deliberate investment or invisible overhead.
The Commercial Case for Tracking Utilisation Seriously
Consider a professional services firm with 12 consultants, each with a standard 40-hour week and 46 working weeks per year. At a blended billing rate of £125 per hour, total annual revenue capacity is approximately £27.6m. At 65% utilisation, actual billed revenue is roughly £17.9m. At 70% utilisation — just a 5 percentage point improvement — it rises to £19.3m. That difference of £1.4m in annual revenue comes from the same team, with no additional hiring, no new clients, and no change in billing rates. It comes from reducing hours that disappear into non-billable activities without being tracked, challenged, or optimised.
Why Spreadsheets Cannot Track Utilisation Effectively
Tracking utilisation manually requires pulling timesheet data, filtering non-billable categories, dividing by total available hours, and repeating for every person. By the time this is complete, the data is at best a week old — and the decisions that should have been made based on it have already been made without it.
Spreadsheets also fail at the definitional layer: without enforced categorisation in the time logging system, different managers define "billable" differently, making comparisons across the team meaningless. The analysis is always historical — you learn what last month's utilisation was, never what this week is trending towards. And someone must own, update, and distribute the spreadsheet — a non-billable overhead that often consumes more capacity than the insights are worth.
What Good Billable Utilisation Tracking Looks Like
- Real-time visibility — individual utilisation rates update as timesheets are submitted, continuously.
- Team-level rollup — aggregate picture across departments or seniority grades visible in a single dashboard without manual calculation.
- Planned versus actual comparison — the gap between what the resource planner shows and what was actually logged reveals where planning assumptions break down.
- Target versus actual tracking — each person's current position relative to their utilisation target, updated live.
- Historical trend reporting — declining utilisation is often an early warning of margin pressure that precedes financial impact by several months.
How to Set and Manage Utilisation Targets
Utilisation targets should be set at the person level — the right target for a senior partner who spends significant time on business development is different from the right target for a mid-level consultant whose primary role is client delivery:
- Directors and partners: 50–60% billable utilisation
- Senior consultants and managers: 65–75% billable utilisation
- Consultants and associates: 75–85% billable utilisation
- Junior team members: 80–90% billable utilisation
These targets should be agreed with each team member and visible to them in real time. When people can see their own utilisation figure and understand the firm's target, they are better placed to flag when their allocation is insufficient.
The Connection Between Utilisation and Project Profitability
Billable utilisation and project profitability are two sides of the same coin. High utilisation tells you that your team's time is being converted into client-billed hours efficiently. Project profitability tells you whether those hours are generating adequate margin. The most commercially sophisticated professional services firms track both metrics together, in the same system — because when a project turns amber on budget consumption, the natural next question is which team members' hours are driving that overrun, and whether those hours are billable.
How Hourglass Tracks Billable Utilisation
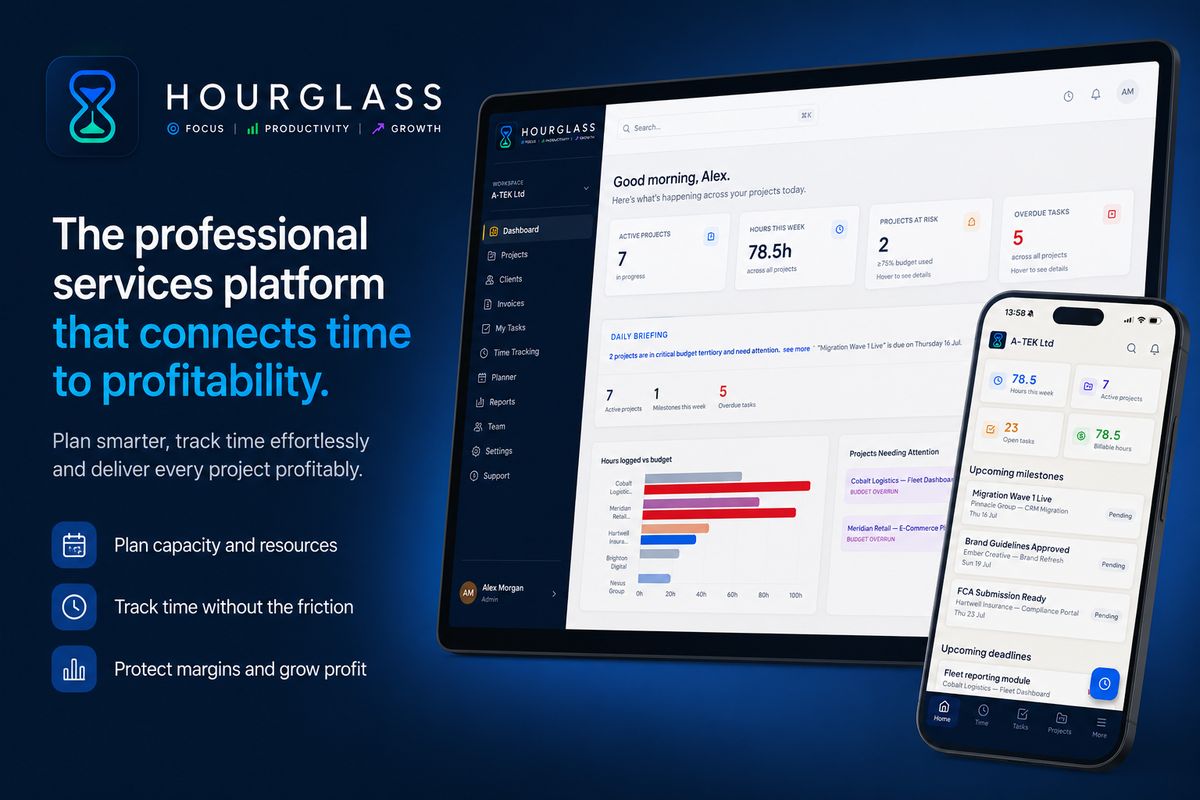
The Hourglass team utilisation dashboard shows each person's billable percentage for the current week, month, and rolling quarter — updated live as time entries are submitted. The engineer planner connects resource allocation to utilisation tracking: you plan who is working on what project and for how many hours, the team logs their time, and the platform compares plan to actuals automatically. For leadership teams who need to report on utilisation for board packs or investor updates, Hourglass generates exportable utilisation reports by person, project, or time period in a format suitable for presentation without further formatting.
Frequently Asked Questions
What is a good billable utilisation rate for a UK consultancy?
Most UK professional services firms target between 65% and 80% billable utilisation across their delivery team. Directors and partners typically run at 50–60% to accommodate business development and management. Senior consultants and managers target 65–75%. Junior and mid-level delivery staff typically target 75–85%.
Why does my billable utilisation feel higher than the numbers show?
The most common cause is non-billable time that is not being logged. If team members only record client-work hours and leave internal meetings and administrative tasks unlogged, the denominator in the utilisation calculation (total available hours) remains constant whilst billable hours understates the non-billable proportion — producing a figure that is artificially higher than reality.
What is the right cadence for reviewing team utilisation?
Most professional services firms benefit from a weekly utilisation review. The question to answer each week is simple: is anyone trending significantly above or below their target, and if so, what action is required? Monthly reviews are too infrequent — by the time you discover that a team member has been at 40% utilisation for three weeks, you have already lost the capacity to recover those hours.
Hourglass is a professional services delivery platform built for UK agencies and consultancies. Start your free trial at hourglass.syncrasoft.com — no credit card required.